2018’s Best & Worst Cities for Millennials with Student Debt
With the ever-increasing price of a higher education in the United States, students now graduate with more debt in student loans than ever before. Merely a few decades ago, student loan balances were small enough to be repaid easily, and generally speaking, under less onerous terms. More than ever before it pays off to choose wisely when it comes to deciding where to start your career and your adult life. To help recent graduates make an informed decision on where to kick off their independent lives, RewardExpert analyzed data from government and private sources to determine the ten best and worst cities & metropolitan areas for Millennials with substantial student debt.
Our selections are places where Millennial college graduates face a favorable job market, housing market, business climate, and a positive generational trend where there is a growing population of younger, educated individuals, who are doing well for themselves compared to their older, more established new neighbors. We made our selections based on performance across 23 metrics grouped into five categories: housing availability and costs,
transportation infrastructure and transit access,
availability and accessibility of jobs requiring a college degree or higher,
tax rates; and
local trends in debt and credit.
Generational Insights
Note: RewardExpert defines the Millennial and post-Millennial generations as those individuals born from 1982 through 1995, and from 1996 and forward, respectively. In doing so, our definition conforms and corresponds to Experian’s definitions and data for “Gen Y” and “Gen Z.”
Student debt is clearly on the rise in the Millennial and post-Millennial generations, both in terms of balances and the proportion of their total debt load, yet credit card debt is much lower in these generations. Furthermore,revolving debt makes up a smaller percentage of their total debt load than the general population in 95.2% cities and metropolitan areas assessed in our study. The future will tell whether this is truly a generational shift, or whether Millennials will acquire just as much consumer debt as their elders.
Top 10 Best Cities & Metropolitan Areas

 92.21%Lincoln, Nebraska
Lincoln, Nebraska is the state capital and home to the University of Nebraska, which is second only to the state government as the largest employer in and around the city. Accordingly, Lincoln takes first place in part due to a strong job market for its well-educated population, and a low unemployment rate of 2.75%. Lincoln performed even more highly on measures of housing and transportation costs, with a median commute distance of 14 miles and an average gross rent of $698. With such a low cost of living you can put more money toward paying off debt without sacrificing any quality of life.

 90.84%La Crosse-Onalaska, Wisconsin-Minnesota
Straddling the Wisconsin-Minnesota state line, the La Crosse-Onalaska metropolitan area takes second place due to the fact that, with one exception, nowhere else are Millennials doing better financially than here as compared to members of the older generations. Millennials living in the La Crosse-Onalaska region have 33% less credit card debt than the area average, even while using only 21% more of their available credit line than the median for residents of all ages. Unemployment is a mere 2.7% and housing is relatively inexpensive, especially for higher income renters.

 89.14%Milwaukee-Waukesha-West Allis, Wisconsin
Coming in at number three, the Greater Milwaukee metropolitan area is the most populous one to make the cut for our top ten, with a population of approximately 1.5 million residents. Milwaukee is linked by road and rail with the rest of the Great Lakes Megalopolis, and lies within commuting distance of Chicago. Naturally, the Milwaukee metro area scores highly for housing and transit access and affordability, with median rent at $740, median monthly costs for homeowners at $1,328, and an above average median income for renters, who make up 39.59% of area residents. Median student debt for the Milwaukee CBSA is $1,072 lower than the national average, and younger residents have lower than average total debt burdens and lower credit card balances.

 85.07%Omaha-Council Bluffs, Nebraska-Iowa
Omaha has been recognized by Forbes as the number one “Best Bang-for-your-Buck” city in the country, as well as the number one “Fastest Recovering City,” and it shows in the data. Renters in the fourth-place Omaha-Council Bluffs metropolitan region are on average slightly-better off than those in Milwaukee ($32,890 median income versus $31,243), with monthly rents averaging only $1 more. This leaves more money available each month to pay down credit card or student loan balances. Commutes average a mere 13 miles in this compact metropolis of nearly a million people, while unemployment stands at a low 2.85% with approximately 38% of jobs in industries typically requiring a college education. Millennials in Omaha have slightly less debt than average, and average credit scores 27 points higher than the national average for the cohort.

 84.13%Columbia, Missouri
Our next pick, the city of Columbia, and the surrounding metropolitan area that encompasses most of Boone County, Missouri, is an undervalued housing market according to CoreLogic’s Home Price Insights data, and is predicted to remain undervalued by 2022. The region is home to an educated population, with numerous students and employees of the University of Missouri, Stephens College, and Columbia College, and is home to a large population of renters (45.83%). Homeowners in Columbia face favorable conditions, with median monthly expenditures around $1,100. While debt loads in the Columbia region are higher than average in dollar amount, across all generations, the younger generations are keeping pace with the regional averages, rather than falling behind.

 83.03%El Paso, Texas
The city of El Paso, and the metropolitan region centered on it in Far West Texas and southern New Mexico has been recognized on a yearly basis for its lowest-in-the-nation crime rates for the past four years (one of the top three for a decade). As our sixth best metro for graduates with student and other debts to cut their teeth and pay down debt, safety is icing on the cake. With lower than average median student debt of $14,715, and 41% of its workforce in industries requiring higher education, young professionals can take advantage of its very low housing costs (median gross rent $756, and median monthly housing costs for homeowners a low $971). Additionally, Texas does not impose a state income tax, enabling locals to allocate a larger chunk of their income to debt.

 83.00%Anchorage, Alaska
Anchorage takes seventh place on our list in no small part due to the absence of state tax levies on either personal income or sales. In fact, Alaska residents effectively enjoy a negative income tax, receiving a yearly Permanent Fund Dividend payment from the state’s petroleum revenues. Anchorage is the most renter-friendly metro in the country, in spite of apparently high rents (median $1,163), however renters have a median income of $48,981 (homeowners rake in a median yearly income of $99,061). Combined housing and transportation costs amount to only 58.6% of annual income, which is dramatically lower than the national average of 75.4%. High incomes, short commutes (average 12.5 miles), and low taxes make it no surprise that only 9.8% of Anchorage residents have any student debt remaining, and likewise no surprise that Millennials make up 23.79% of the population.

 81.69%Champaign-Urbana, Illinois
With lower than average total and student debt loads, credit utilization, and credit card balances for Millennials and the oldest members of the Gen Z who are just now graduating from college, the Champaign-Urbana metropolitan area of Illinois takes eighth place on our list in no small part due to their healthy financial lives. Home to flagship campus of the University of Illinois, aggressive urban development, a burgeoning tech industry, as well as inexpensive housing (with median monthly gross rent at $780, and combined housing and transportation costs in the 35th percentile), it is an affordable and attractive area for new graduates.

 81.59%Mankato-North Mankato, Minnesota
Coming in at ninth place is the Mankato-North Mankato metropolitan area of Minnesota. Mankato is another college town that is an attractive and advantageous place for new graduates of Minnesota State University and other area colleges, as well as graduates from further afield. The unemployment rate of 2.4% is among the lowest in the nation, and area Millennials and post-Millennials have among the lowest debt loads and highest credit scores: residents ages 23-34 carry an average total debt of $26,989, of which $2,801 is credit card balances (the national averages are $32,599 and $3260), while those under 23 years old have on average a mere $8,875 in total debt with $1,340 on cards ($13,812 and $1,401 nationally). These figures compare quite favorably to the regional average for all age groups.
 80.99%Fargo, North Dakota-Minnesota
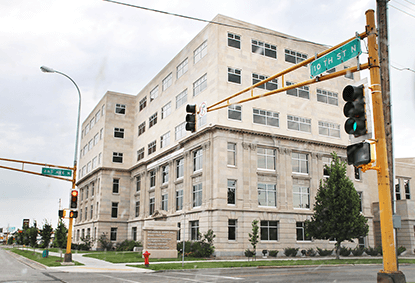
Finally, at tenth place we have the Fargo metropolitan area, which includes all of Cass County, North Dakota, as well as the city of Morehead and Clay County in Minnesota. Fargo has been named by Forbes as the number four fastest growing city in the nation (the city is already home to 16% of the state’s population, and during no decade since it was founded has Fargo experienced a population growth rate below 13.8%), as well as the best city to start a business or a career. Unemployment is extraordinarily low, at 2.8%, while housing and transportation costs (as compared to the median income for the area) are lower than 95% of all cities and metropolitan areas included in our analysis. Average to slightly above average debt levels are offset by high credit ratings among Millennials (662), and best in the nation credit among the general population (701).
Bottom 10 Worst Cities & Metropolitan Areas

 38.02%Meridian, Mississippi
Meridian, Mississippi is rated dead last as the worst city and metropolitan area for the financially prudent, career-minded, newly minted college graduate. While the overall tax burden is relatively low, so are incomes in the area for renters and owners alike ($22,351 and $44,936). The median annual housing and transportation costs amount to $18,501 which is 82.77% of the median income for the 32% of the area’s population who rents. Homeowners, who have median incomes nearly twice as high, don’t get off much easier: housing and transportation still eats up 51.56% of their $44,936 annual income. With a sky high unemployment rate of 10%, and a particularly tough job market for graduates (29.8% of employment in industries typically requiring a college degree versus the 34.6% average across all metros included in our study), Millennials here are faring poorly, with an average credit score of 597 and an average credit utilization rate of 42%.

 42.21%Dothan, Alabama
As the “Peanut Capital of the World,” the Dothan, Alabama metropolitan area is an uninviting, inhospitable, and inauspicious place for Millennials with debt to start their careers. With a job density of 1.322 jobs per square mile (well below the average across all metros, 3.663 per square time), an average commute distance of 41 miles, and no transit to speak of, literally working for peanuts is not an entirely unlikely prospect in Dothan. Generational debt and credit indicators show that the 17.68% of the population born between 1982 and 1995 are doing poorly, and would be wise to leave in search of better opportunities - if they are able to.

 42.54%Wilmington, North Carolina
The Wilmington, North Carolina metropolitan area comes in third from last for its relatively high housing and transportation costs, proportional to median incomes in the region: after accounting for the median annual rent of $11,256 and transportation costs of $12,566, only $7,094 is left of the median annual income of $30,916. Millennials and post-Millennials in the Wilmington metro area have higher credit card balances, more student loan debt, as compared both to older generations in the region and their peers elsewhere in the country. An 8.8% unemployment rate and a housing market rated as overpriced according to CoreLogic’s Housing Price Insights data cement Wilmington’s place as a poor choice to start your adult life, even if it might be a good choice for a vacation, or for retirement.

 42.88%Hattiesburg, Mississippi
The second metropolitan area out of four in the great state of Mississippi to grace the bottom of our list, Hattiesburg is in some ways worse than Meridian. The average renter here is left with barely more than $2,000 per year after housing and transportation, while the unemployment rate is an astonishing 10.7 percent. Compared to Meridian, Hattiesburg has more and closer employment opportunities for degree-holders, as well as a larger and slightly better-off Millennial population. This doesn’t make much of a difference when it is a matter of a generation that is still more indebted than the national average ($35,113 average total debt), in an area where the overall average debt totals $40,029 (over and against the average $38,059).
 43.68%Charleston-North Charleston, South Carolina
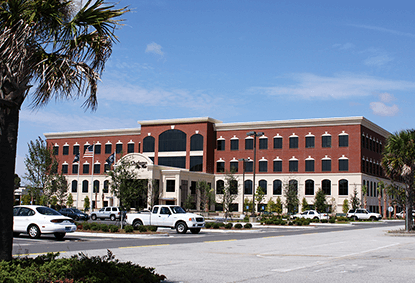
The Charleston-North Charleston, South Carolina metropolitan area is home to 716,000 of the nation’s most debt-encumbered people, and none are more weighed down than the region’s educated recent graduates and older Millennials. Median student debt balances are among the highest, at $18,346, and a total of 19.39% of the area population has at least some student loan debt. Residents ages 19-35 likewise carry higher credit card and total debt balances than in the average U.S. metro. With an economy heavily dependent on tourism, industries in which degree-holders dominate represent a smaller share of area employees than the national average, 32.53% to 34.6%.
 44.40%Columbus, Mississippi
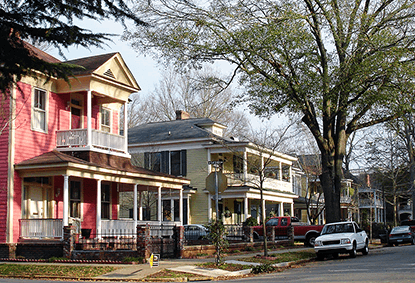
The city of Columbus, located in northeastern Mississippi, lies smack dab in the middle of a land where formerly cotton was king. Today it bears the dubious distinction of being the worst city in the country to rent a home on local average working wages: the combined cost of rent and transportation eats up a whopping 98.2% of the median income. There is no public transportation, and the average worker drives 44.85 miles to work, and the area unemployment rate is an astronomical 13.2%. Last, and possibly least, Millennials in the area have above average debt loads ($35,013) and subprime credit scores, averaging 597.

 44.69%Chattanooga, Tennessee
Unlike most metropolitan areas at the bottom of our list, the greater Chattanooga, Tennessee metropolitan area (which spills over into Georgia) has a few things going for it, notably a significant number of tech startups, and the country’s largest municipally owned and operated fiber optic network and high-speed internet service. The regional economy, however, is still dominated by the manufacturing and service industries, with a consequently low level of opportunity for degree-holders to find employment in a suitable industry (70.61% of the metropolitan workforce is blue-collar jobs, food services, and service industries). The housing market in the area is currently overpriced, according to the October 2017 Home Price Insights report, and CoreLogic projects that it will remain overvalued in October 2022. Finally, while only 10% of the region’s 500,000+ population currently has student debt, this reflects educational attainment in the area rather than the financial habits of college graduates under 35, who nevertheless have every bit as much debt as their more educated peers elsewhere.

 44.79%Greenwood, Mississippi
The last of four cities in Mississippi to rank in the bottom ten, Greenwood has no shortage of superlatives. The two-county micropolitan area anchored by Greenwood has the highest unemployment rate, a shockingly high 14.05%, and combined housing and transportation costs are higher than anywhere else compared to area incomes. With no public transportation, long commutes by car that average about 44 miles are the only choice.
Additionally, Millennials in Greenwood have the worst average credit scores in the nation (567).

 44.95%Paducah, Kentucky
The metropolitan area anchored by the city of Paducah is home to a population of almost 100,000 across three counties in Western Kentucky, and one county across the state line in Illinois. Like number eight Chattanooga, the percentage of this population burdened by any amount of student loan debt is a comparably low 10.07%, for all of the same reasons. With 1,108 employees, WalMart is the fourth largest employer in Paducah. Only two hospitals and the public school system have more employees, and there is little opportunity for graduates outside of the healthcare, education, and government sectors. Generational credit and debt statistics bear this out: While Paducans have lower average debt loads than the average for all metro areas included in Experian’s data ($34,600 to $38,059), area residents under the age of 35 are falling behind and faring worse than their older neighbors and their national peers ($31,247 in debt on average to $32,599 nationally, among residents between 23 and 34 year olds in Paducah, and $15,330 to $13,812 among those under the age of 23).

 45.33%Traverse City, Michigan
Completing our list of the worst places to start your career and reduce your degree-related debts is the only one that is not in the South Atlantic region of the United States: Traverse City, Michigan. RewardExpert has recently recognized Traverse City as one of the best places in the Midwest to buy a vacation home, and it has also been recognized by US News as a top-ten city for retirement. It is a less than favorable place for young professionals: while unemployment is comparable to the national average, at 5.8, transportation costs are high, public transit is inadequate and used by just 1% of area workers, and the average commuter drives 48 miles on a daily basis. Despite better than average consumer debt and credit balances among younger adults, a disproportionate amount of this is higher-interest credit card and retail debt: 10.01% for Millennials, and 26.5% for post-Millennials.
Methodology

RewardExpert aggregated and analyzed data at the level of metropolitan/micropolitan areas defined as Core-Based Statistical Areas by the Census Bureau. We started with generational credit and debt statistics from Experian’s 2016 State of Credit, and ranked each city along five axes: Student & Other Debt/Credit;
Housing and Transportation Affordability;
Employment, Education & Access to Jobs and Retail;
Taxes and Income; and
Generational Financial Trends.
With the exception of the first and the last category, scores for each were computed to reflect how, on average, each city and its surrounding metropolitan area performed against others on various indicators, expressed in terms of a percentile ranking. In these two, it was necessary to include an additional factor: in the first case, the percentage of a typical Millennial’s debt load that consists of student debt is used to offset total indebtedness, to reflect the lower amount to be repaid as compared to a comparable quantity of revolving debt; in the latter case, we used credit card debt, credit utilization, and student debt figures broken out for each generation in Experian’s 2016 State of Credit Report data, to calculate a score to capture how well Millennials in each area are doing in comparison to earlier generations, and comparison to the peers in other cities across the nation. We then calculated a final composite score as a weighted average of each of these five scores, and selected our top and bottom ten accordingly.
Metrics By Category:
Student & Other Debt/Credit:
- % With Student Debt
- Median Student Debt
- Average Total Debt
- Average Retail Debt
- Average Credit Card Debt
- Average Credit Score
- Credit Utilization
Employment, Education & Access:
- Unemployment rate
- Employment Access Index
- Job Density, Median Commute Distance
- % Employment in Industries Requiring Education
- Retail Access Index
Housing and Transportation Affordability:
- Monthly Housing Costs (Homeowners)
- Average Gross Rent
- Average Transportation Cost
- % Transit Commuters, Median Income (Owners and Renters)
- Current and Forecasted Valuation (Over- or Undervalued)
- Combined Transportation and Housing Costs % of Area Median Income
Generational Trends:
- Student Debt % of Total Debt Millennial/Gen Z vs. all-generation local average
- Millennial & Gen Z total debt, credit score, credit card debt, utilization % of all-generation local average.
Taxes & Income:
- Combined Tax Burden (Including: Income, Property, Sales, and Fuel Taxes)
Sources:
Student & Other Debt/Credit:
Taxes & Income:
- Avala Tax Rates API
- TaxCloud
- State, County, and Municipal Government Sources
(All data for this category other than LAI scraped from the map on Data table dumped to csv. These are sources of this data.) - Location Affordability Index
Housing & Transportation
- Housing and Transportation Affordability Index (CNT / HUD & DOT)
- Location Affordability Index (CNT / HUD & DOT)
- Home Price Insights (CoreLogic)
Employment, Access & Amenities
Indicators
Sources:
