2018 Labor Day Air Travel Forecast
Delayed flights, cancelled flights, flights that wind up being diverted: these are but a few of the everyday travel hassles that can become so much worse during peak holiday travel periods. While most of us experience congestion on highways during Labor Day, those flying have it no better. For those taking to the skies for Labor Day this year, this forecast examines the track record of airlines and airports over the past five years to see which days and places, and on whose planes, you’re most likely to get to your destination without undue delays.
RewardExpert analyzed Department of Transportation flight data from the past five years to determine on-time performance averages and trends for airlines and airports, and to predict which days are—historically speaking—most likely to be delay and hassle free, and which days to avoid traveling, if at all possible. In this report, we examine the on-time performance record of the top nine domestic airlines and the 45 busiest airports in the U.S. over the Labor Day travel period. Our analysis of statistics for the last five years enables us to determine the best and worst days to travel during the eight days surrounding the holiday.
Best and Worst Days to Travel During the Labor Day Travel Period
RewardExpert examined DOT flight data during the period starting on the Wednesday before Labor Day weekend and ending the following Wednesday, for a total of 8 days, from the years 2012 to 2017 to assess which days during the travel period have the best on-time performance. We also made reference to our previously calculated on-time performance averages for the five-year period from 2011 to 2016 to better view longer term trends.
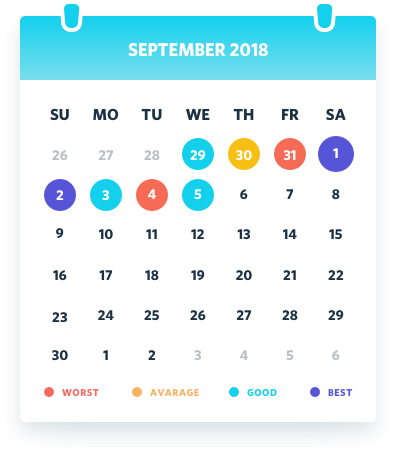
- For a smooth and stress-free journey, avoid traveling on the Friday before Labor day, as well as the Tuesday after it. These have historically been the worst days for on-time departures and arrivals.
- Like all holiday travel periods, the dates on which you’re most likely to depart and/or arrive on-time are the days you’d least like to be traveling: the top three days for the fewest flight delays are, of course, Labor Day Monday and the Saturday and Sunday preceding it.
- Your best bet for a prompt, relatively stress-free return trip, is to either depart without delay Monday evening, or to wait out the rush and travel on Wednesday (if you are able, of course).
- Even with the impact of Hurricane Harvey causing countless flight delays and diversions at both of Houston’s major airports on the Wednesday before Labor Day last year, the Wednesday prior to Labor Day remains the fourth-best day to travel, according to our five-year average figures. Delaying even one day can make all the difference—unless there’s a storm going your way.
The Busiest, Best, and Worst Airports for On-Time Performance
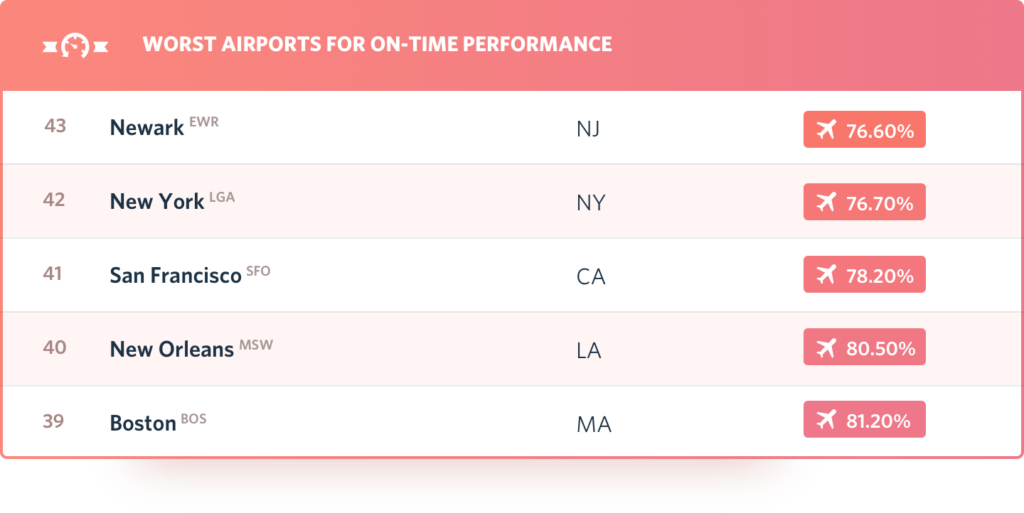
RewardExpert examined DOT data to determined the on-time performance for 45 major airports. The table below presents average number of arrival and departure flights during the travel period by domestic airports, the percentage of flights that were on time by airport during the travel period, and historical trends over the last five years.
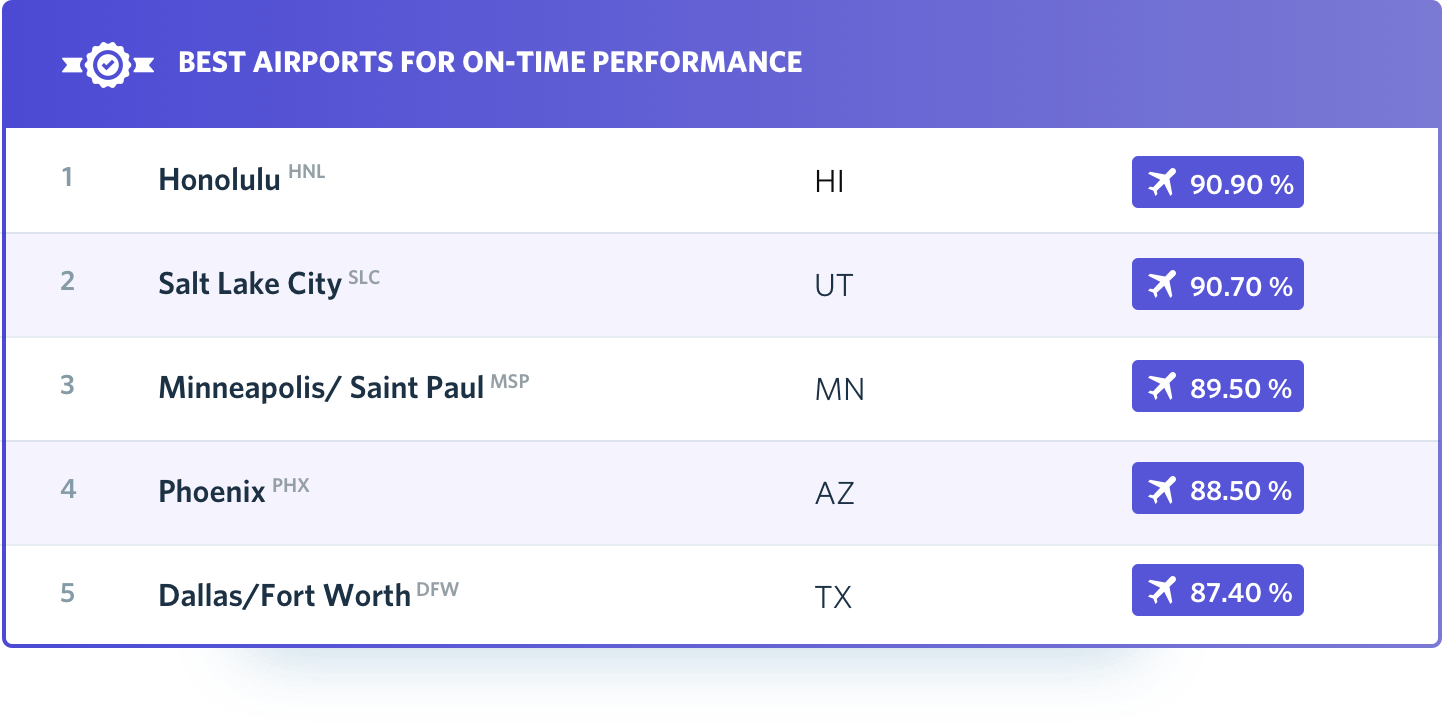
- For those who can afford it, Hawaii remains a choice destination for those among our audience who don’t mind embarking upon one of the longest possible domestic flights for a short vacation, but who do mind, terribly, getting stuck at the gate, on the tarmac, or in a holding pattern waiting to land. While delays were on the rise from 2011 to 2016, Honolulu still had the highest percentage of on-time arrivals and departures, and from 2016 to 2017, on-time performance at Honolulu ticked upward to 94.45 percent of all flights.
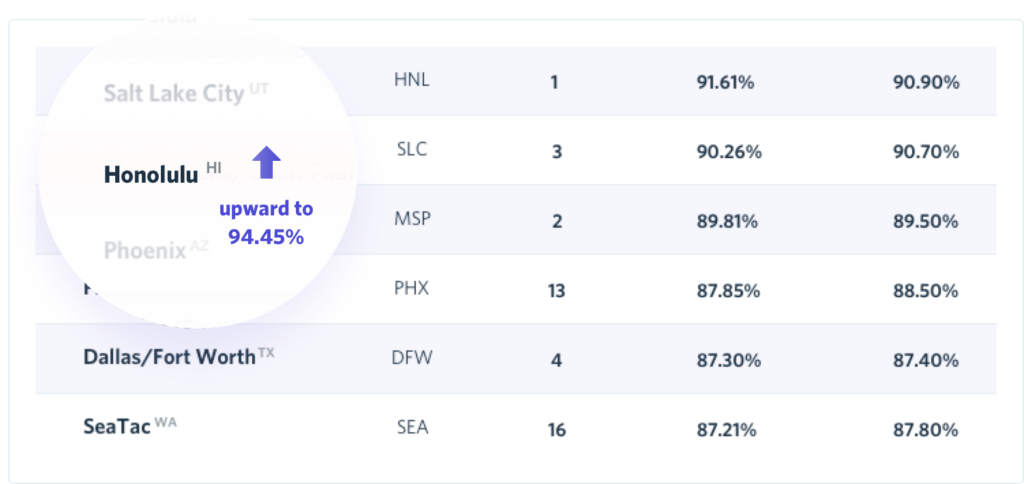
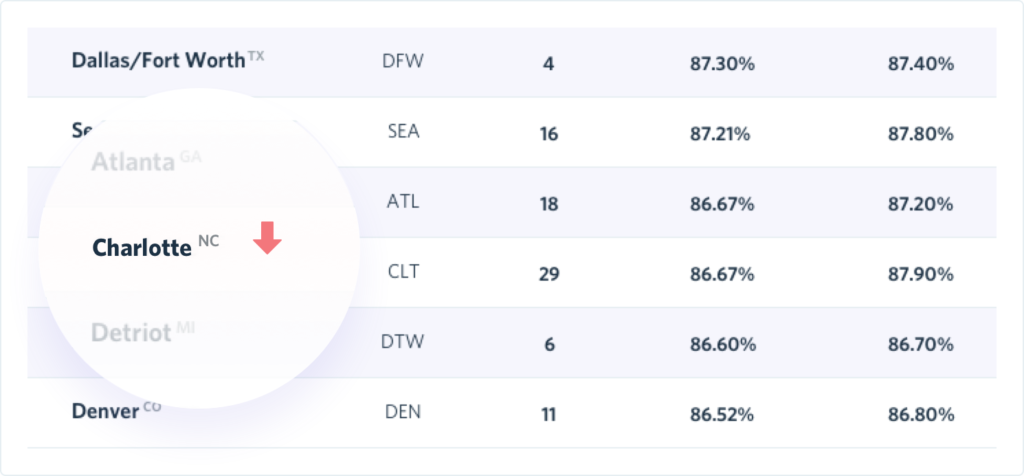
- Beware of increasing delays flying to and from North Carolina’s major urban centers and transportation hubs. On-time statistics for both Charlotte and Raleigh-Durham airports showed a negative trend in on-time performance from 2011 through 2016 (decreasing by 3.9 percent and 6.1 percent respectively), and with data in for Labor Day 2017, this trend-line continued on its downward path. While Charlotte remains high in our ranking—relative to other airports—it is where we saw the sharpest decline in on-time performance last year: a whopping 6.16 percent decline, falling three places from fifth place in last year’s ranking to eighth this year.
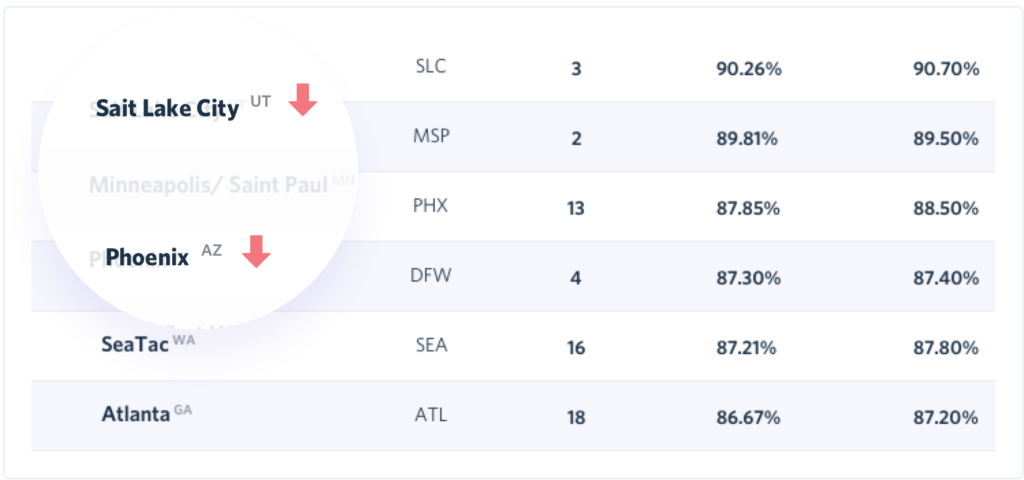
- Regular high-performers in terms of on-time performance, Phoenix and Salt Lake City, while still ranking highly on our five-year average ranking, also continue downward trends in on-time performance, by 3.27 percent and 2.21 percent. Areas with high rates of population growth and development mostly show signs of increased congestion.
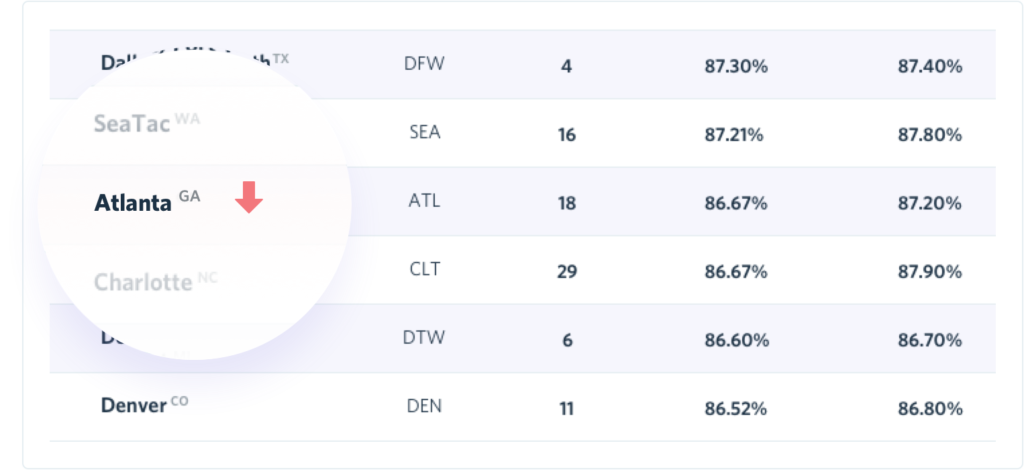
- Atlanta’s Hartsfield International Airport retains the title for the busiest airport in the nation. On-time performance at ATL declined by 2.63 percent from its five-year average on-time performance of 87.21 percent to 84.86 percent last Labor Day weekend. While correlation is not causation, and it is impossible to tell whether the uptick in delays at Atlanta is caused by Delta Airlines’ almost identical increase in delayed flights (2.36 percent), or whether Delta’s woes are due to delays at its hub in Atlanta.
- Major airports in the Northeast, including Washington, D.C.’s Dulles International Airport, BWI, and New York’s LaGuardia airport saw some of the greatest improvement in on-time departures and arrivals, along with and Chicago’s O’Hare. O’Hair and Dulles saw slightly greater increases of 2.36 and 2.54 percent respectively, but it will take several years of continued improvement in on-time departures and arrivals to improve their overall standing. LaGuardia is a case in point: despite a 4.57 percent improvement in on-time flights during Labor Day 2017, it remains second only to Newark as your best bet for experiencing delays.
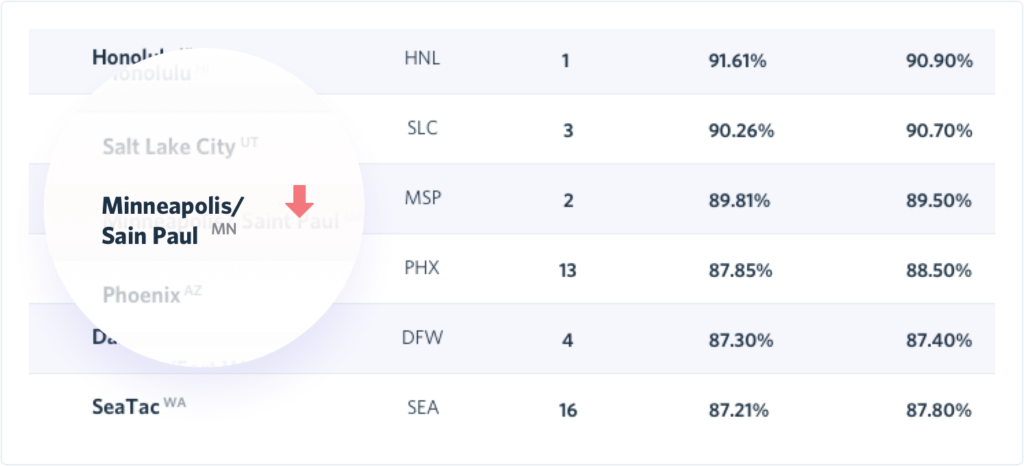
- Already one of the best airports in terms of the overall likelihood of delayed flights over the Labor Day travel period, Minneapolis-Saint Paul boasts an average of 89.81 percent of flights arriving and departing on-time. In 2017, flights were on-time 91.05 percent of the time (the second best airport performance that year), 1.55 percent above its previous five-year average. In one year, Minneapolis-Saint Paul’s on-time performance improved by more than it did over the five years from 2011 through 2016 (1.10 percent).
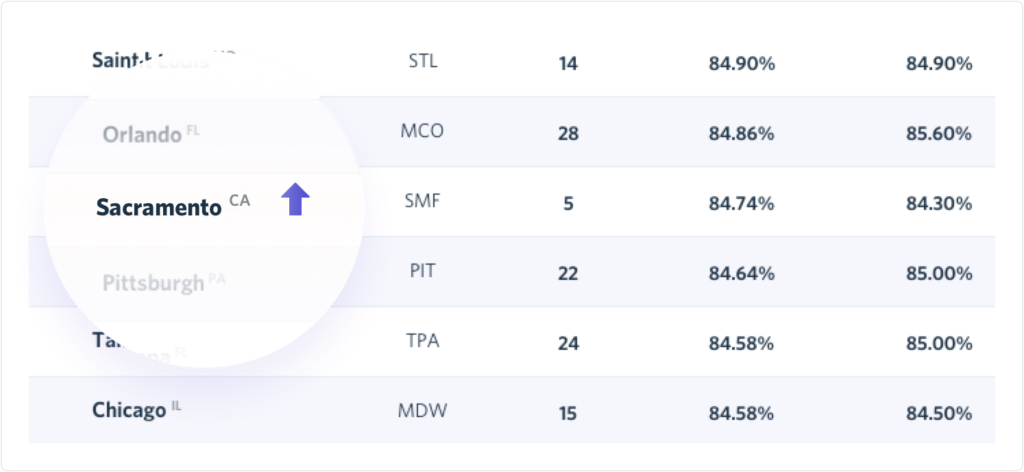
- Sacramento climbed nine places in our overall forecast ranking to number 22, with on-time flights increasing by 2.21 percent. California-bound travelers would do well to consider flying in to Sacramento and traveling by ground to their final destinations rather than using Oakland or San Francisco.
- Due to the severe impact of Hurricane Harvey on the Greater Houston area, which caused a large proportion of Houston-bound flights to be canceled or diverted and prevented most flights from departing either airport on at least the first day of the Labor Day travel period last year, both airports have been excluded from this year’s forecast and ranking. For the period of time starting on August 30th and ending September 6th, 2017, both Houston-area airports ranked dead last for on-time performance due to extreme weather conditions.
On-Time Performance Ranking of the 10 Major U.S. Airlines
RewardExpert examined DOT data to determine the on-time performance of major U.S. airlines. This list displays the percentage of flights by airline that were on-time or delayed by less than 15 minutes during the Labor Day travel period.
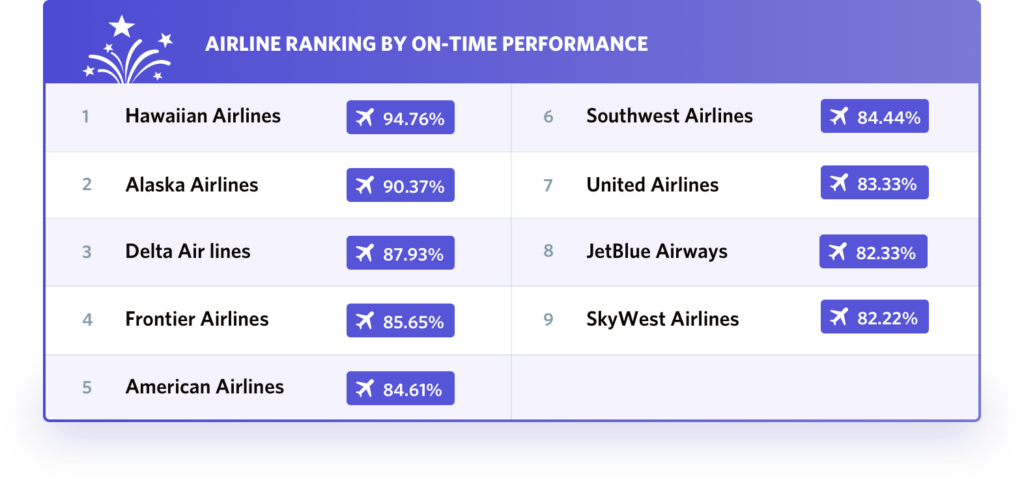
- Whether or not the weather typical of the Hawaiian destinations served by Hawaiian Airlines plays a significant role in making it the most consistently and reliably timely carrier, Hawaiian continues to reign supreme over all others for on-time performance during the labor day travel period and beyond. In fact, Labor Day 2017 saw Hawaiian Airlines’ already impressive on-time performance rate tick upward from an average 94.3 percent (2011-2016) to 96.59 percent.
- While its on-time performance during the Labor Day travel period was less than stellar, Alaska Airlines retains its status as the second-best performing airline in our rolling five-year average on-time performance ranking. Labor day weather in Alaska can be either fair or foul from year to year, and from place to place. We can conclude that it’s not the destinations served that makes an airline great, but that smaller airlines tend to have a lower rate of delays in departing and arriving.
- JetBlue’s on-time performance average for the 2017 Labor Day travel period was 4.64 percent higher than its average performance from 2011 through 2016. Last year, JetBlue tied for second place with Delta Air Lines over the Labor Day period with both airlines reporting 86.04 percent of all flights being on-time. If this turns out to be a trend and not a fluke, another strong year or two will see JetBlue become the first budget carrier to break into the top tier, performance-wide.

How to Make Your Labor Day Vacation Better
Getting the right credit card can really make traveling—particularly by air—a lot more comfortable. Whether you’re stuck in an airport, renting a car or booking a hotel, a premium credit card can make everything go more smoothly and, believe it or not, save you a lot of money.
You should consider getting one of these cards before you embark on your Labor Day getaway.
Relax in an Airport Lounge
Unfortunately, long layovers and unexpected delays are an everyday occurrence even if you fly just a few times a year. That’s particularly true if your vacations are planned around holidays and long weekends, like Labor Day.
While it’s impossible to avoid these problems, getting complimentary access to an airport lounge can really make your life easier. Not only will you avoid the hustle and bustle of a busy airport gate, but you’ll have access to complimentary food and drinks, not to mention TV, Wi-Fi and other amenities.
While there are a number of great cards, like the Chase Sapphire Reserve and Citi ThankYou Prestige, that offer free access to a 1,000+ lounges in the Priority Pass network, the Platinum card from American Express is perhaps the best premium card on the market for airport lounges.
That’s because you’ll be able to get into Amex’s swanky Centurion Lounges. Chef-created meals and top-shelf cocktails compliment a whole host of comforts. Depending on the location, you can enjoy free spa treatments, wine bars, family rooms, showers and more.
Get Elite Status and More
All of premium travel cards offer complimentary elite status and other perks with a variety of hotels and rental car agencies. The Platinum card, for instance, gives you Gold status with Starwood and Hilton, and the Sapphire Reserve gives you special privileges with National, Avis and Silvercar.
In addition to a variety of travel credits, such as the Citi Prestige’s Airline Fee credit that covers up to $250 in baggage charges and other fees, all of these cards will reimburse you for the cost of TSA PreCheck or Global Entry. You’ll be zipping through security, with your shoes on!
Save a Ton of Cash
Not only will these cards make your travels easier and more comfortable, they can also save you a lot of money. You’ll get all sorts of valuable travel credits with any of these cards, plus they all earn rewards that can be used for free travel.
With the Sapphire Reserve, for example, you’ll get triple points for travel and dining expenses and one point per dollar for all other purchases. With the Sapphire, you can either transfer those points directly to frequent flyer programs or redeem at a rate of 1.5 cents per point via the Chase Ultimate Rewards website for airfare, hotels and rental cars.
You’ll be traveling for free—and in comfort—in no time. So what’s stopping you from getting a premium travel card?
Methodology
On-Time Evaluation: A flight is considered on time if it takes off or lands within 15 minutes after the scheduled time shown in the carriers’ reservations system. The data assesses both arrivals and departures taking into account gate-to-takeoff times and landing-to-gate times.
Data Range: RewardExpert analyzed data from the 8 days surrounding Labor Day in the years 2012-2017
Source:
On-time performance statistics for the years 2012-2017, from the Department of Transportation’s (DOT) Bureau of Transportation Statistics.
Indicators
Sources:
